Dissecting Windows Malware Series - Explaining Rootkits: Practical Examples & Investigation Methods - Part 6
All parts in this series
- 1 Dissecting Windows Malware Series - Beginner To Advanced - Part 1
- 2 Dissecting Windows Malware Series - Process Injections - Part 2
- 3 Dissecting Windows Malware Series - Understanding Cryptography and Data Encoding - Part 3
- 4 Dissecting Windows Malware Series - RISC vs CISC Architectures - Part 4
- 5 Dissecting Windows Malware Series - Creating Malware-Focused Network Signature - Part 5
- 6 Dissecting Windows Malware Series - Explaining Rootkits: Practical Examples & Investigation Methods - Part 6
- 7 Dissecting Windows Malware Series - Unpacking Malware, From Theory To Implementation - Part 7
In the previous article /dissecting-windows-malware-series-creating-malware-focused-network-signature-part-5/ we took a big step towards understanding an important aspect of malware analysis - network internals and how malware use them to their advantage.
We analyzed assembly code snippets where malware leveraged various Evasion techniques to:
- Attempt to be seen as legitimate network traffic.
- Make it harder for the analyst to create a network signature.
Later on, we presented fundamental key points to creating precise and accurate network Snort signatures.
In this article, we’ll do a detailed deepdive into Rootkits and Kernel Internals.
Table of Contents
- What’s In It For Me
- Rootkits - What Are They Exactly
- Examples of Rootkits – From Theory to Practice
- A Bit of Kernel Theory Before We Start
- Analysis of Each Rootkit – Behind the Scenes
- Analysis - First Rootkit
- Analysis - Second Rootkit
- Analysis - Third Rootkit
- So What Have We Seen
- So, What’s Next
- References
What’s In It For Me❓
This article, as opposed to most of the previous ones, is suited for a larger group of audience.
Previous articles, were mostly Cyber Security oriented with some extra topics. This one, in addition to being an explanatory review of analyzing Rootkits - will also be beneficial to:
- Computer Science Students
- Low Level Developers
We’ll cover various low level components, such as: device objects, kernel drivers, Windows EPROCESS Structure and much more, stay tuned😎
Rootkits - What Are They Exactly?🧐
Rootkits are essentially a generic name for a family of malware that modifies the operation of the operating system in the attacked endpoint.
Their goal, is to disguise the execution path.
Rootkits are divided into two types, each operating in a different space in the operating system’s memory:
- User-Space Rootkits
- Kernel-Space Rootkits
The names are quite indicative, but let’s state it anyway: one type operates in the User Space, where all programs where initiated by the active user(along with other things like specific drivers, etc.).
Programs running in this space will operate with the minimum permissions required for their proper operation.
Another type operates in the Kernel Space, where the operating system’s core programs run. They are responsible for managing the user-space programs in terms of memory resources, preventing collisions and more.
Programs in this address space are characterized by running with high permissions!
The Kernel Space
    The Kernel Space is intended to be an isolated area, and programs from User Space access it in a controlled manner through system calls such as SYSCALL, SYSENTER, INT 0x2E.
Direct access from User Space to Kernel Space is not possible; so, in practice, lookup tables are used to identify which function in the Kernel we need to call.
Since programs running in the Kernel Space will run with strong permissions, we often see more complex (and harder to analyze) functionalities among Rootkits, such as hiding:
- Files
- Running processes in the system
- Network connections
- And every other valuable resource they can think of
Writing malware that runs in the Kernel is much more complex due to the fewer ready-made and supported functions available – in short, a significant challenge…therefore, only complex malware will include some sort of Kernel manipulation Component.
Examples of Rootkits – From Theory to Practice🏃
We will now present a few examples of how different rootkits behave during execution. Recognizing their operation methods, even at a first glance, will greatly assist later on when we start to dive into and investigate.
First Rootkit
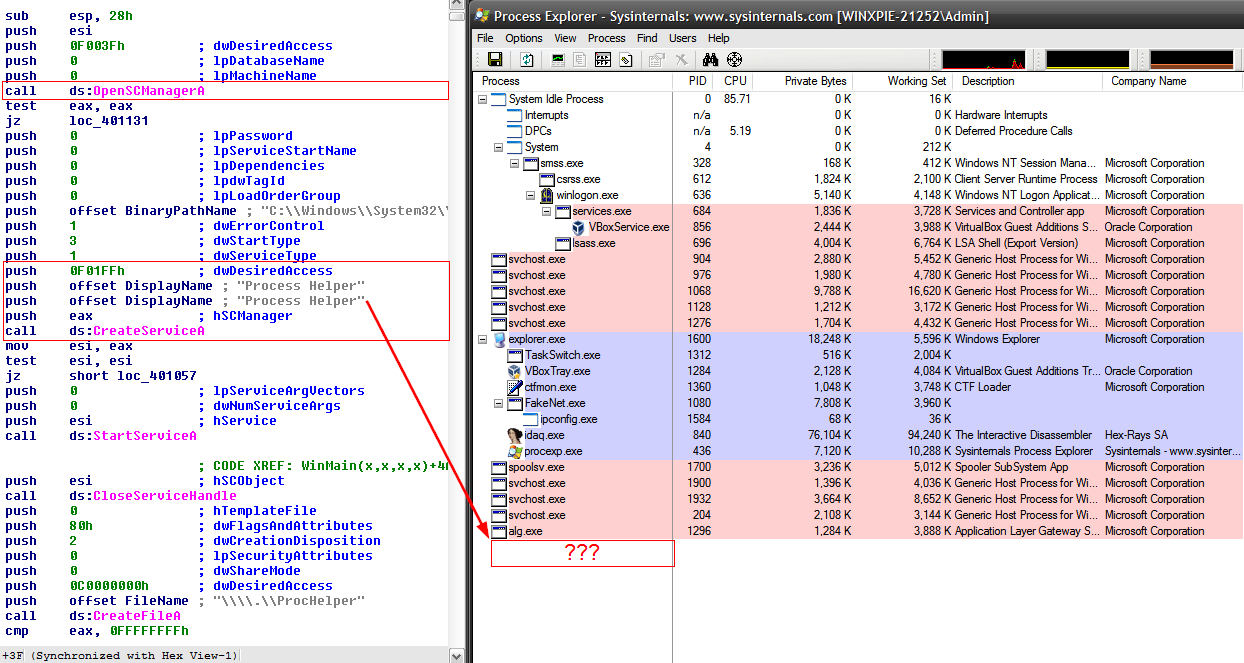
The screenshot below shows a snapshot of an already running rootkit in action.
Reviewing the processes in Process Explorer, there is no evidence that it is actually running. After further analysis in IDA Pro, we indeed see that calls are made to create a service – which raises the suspicion that there is a Kernel Component involved in the background, and indeed it is a rootkit.
Second Rootkit
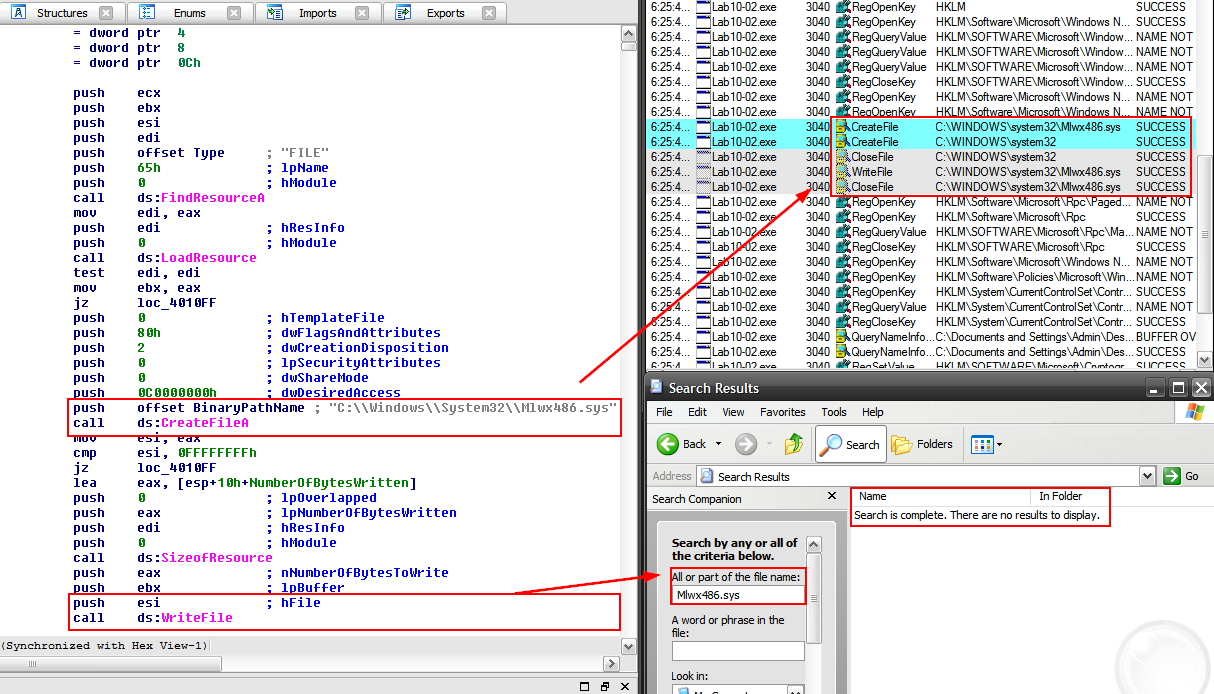
This snapshot below showcases a malware containing a Rootkit component. As the previous one, the malware is already running;
we see evidence of the file Mlwx486.sys being created in the documentation of Process Monitor and it matches the assembly code we see in IDA Pro…however, when we try to access the folder to continue investigating the created file – it is not there.
Third Rootkit
Last but not least, a rootkit that is already running at the endpoint.
Based on the assembly code in IDA Pro, (which, by the way, runs in a separate driver as a *.sys file), it seems that indeed writing and changing the registry is taking place.
The additional driver needs to be found in order to allow the original *.exe file to run properly.
Side Note
Finding malicious files in an attacked endpoint is a domain called – Digital Forensics & Incident Response (DFIR)** – We’ll cover key points in this field in one of the next articles.
Opening Process Explorer, there is no evidence that the file is currently running, and the only evidence of writing to the registry that can be seen in Process Monitor is a generic seed value that changes frequently.
As an additional side note, malware implementing kernel related functionalities, we’ll often see the following:
- Use of functions with the prefix Rtl, for example, RtlWriteRegistry, RtlCreateRegistryKey.
- Use of the executable file: ntoskrnl.exe, which contains functions found in the Kernel Space.
There are kernel functions (with the prefix Rtl, for example, RtlUnwind) that exist in every .exe* file, therefore, we should not rush to determine that every .exe* file containing an Rtl function is a malicious file.
A Bit of Kernel Theory Before We Start📚
Drivers, Device Objects and Driver Objects
Before we present the main analysis of each rootkit, let’s take a moment to understand how we would actually want to analyze malware containing such a kernel component.
As mentioned before, programs and applications do not communicate directly with the kernel. With that being said, Windows does allow programs and applications to run code in the kernel.
Programs cannot directly access Kernel Drivers but do so through Device Objects that forward the requests to specific devices.
Devices are not necessarily physical hardware devices; they are created and deleted, and one can access them through the User Space.
For example, consider a USB flash drive. A driver on the system handles USB flash drives, but an application does not make requests directly to that driver; it makes requests to a specific device object instead.
Now, applications in User Space can access the driver associated with it, which, in turn, accesses the driver responsible for handling USB devices.
When the user plugs the USB flash drive into the computer, Windows creates the “F: drive” device object for that drive. An application can now make requests to the F: drive, which ultimately will be sent to the driver for USB flash drives.
The same driver might handle requests for a second USB flash drive, but applications would access it through a different device object such as the G: drive.
Similar to DLLs, drivers essentially expose functionality to other components.
Whereas DLLs do it through export tables, drivers achieve this by registering the addresses for callback functions. These functions are called when a user-space software component requests a service.
The registration occurs in the DriverEntry routine, which is the procedure called when a driver is first loaded into memory, similar to DLLEntry in DLL loading.
Windows creates a Driver Object structure, which is passed to the DriverEntry routine. The routine is then responsible for populating this structure with its callback functions.
Last but not least, the DriverEntry routine creates a device that can be accessed from user space. The user-space application interacts with the driver by sending requests to this device.
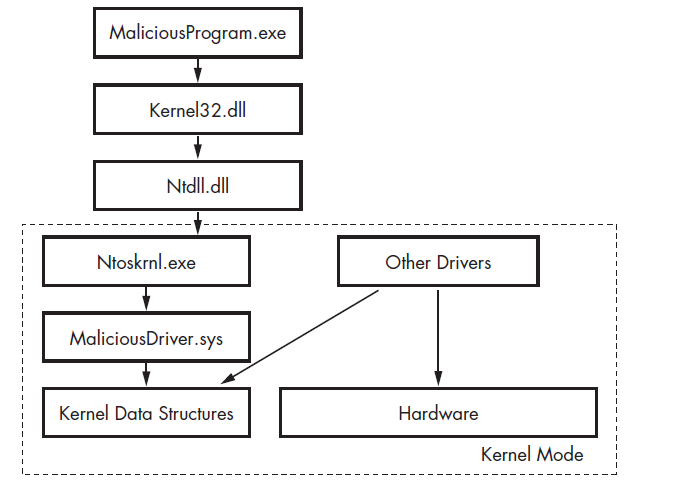 Image Reference: https://www.amazon.com/Practical-Malware-Analysis-Hands-Dissecting/dp/1593272901
Kernel Debugging
Debugging the kernel is more complex than debugging programs running in User Space.
When there is a breakpoint in the kernel (and it is in Debug Mode), the entire operating system “freezes,” since if the kernel is at a breakpoint, who will run the operating system, right?
Therefore, Kernel Debugging is usually performed on a virtual machine (VM) that allows debugging (it requires changing some settings and initial setup).
Kernel Debugging will be performed using WinDbg in the Guest OS for the purpose of performing breakpoints and continuing the running of the malware, and with WinDbg Preview in the Host OS (after all, we need to perform Debugging on the entire Kernel of the Guest OS and therefore we will also need an external machine – where a tool for performing Kernel Debugging will also run).
Analysis of Each Rootkit – Behind the Scenes🔍
We’ll not present here a full analysis of each malware sample but only the process of working with WinDbg Preview and identifying the implementation of the rootkit in Kernel Space.
Analysis - First Rootkit1️⃣
-
We saw in IDA Pro that a service named “Process Helper” is created pointing to some driver in memory: Lab10-03.sys.
-
If we dig a bit more into the assembly code, we’ll discover that a call to the function: DeviceIoControl is made when a module in User Space makes a request to a Device Object managed by a driver.
Following some analysis in IDA Pro we can conclude that a Device Object will be created by the Kernel Driver in .ProcHelper - to allow communication between the User Space Component and the Kernel Driver Component.
- Now, we have a kernel module we want to investigate, so we’ll move to WinDbg Preview and search for the following device object: ‘ProcHelper’ with the command: devobj ProcHelper!
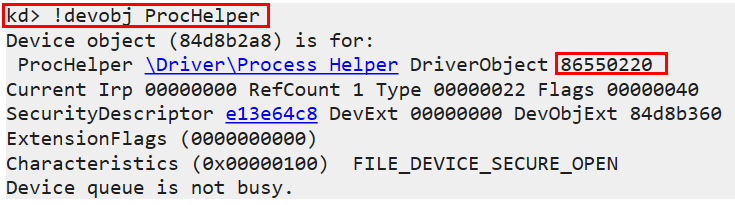
- Once we find the address where it is stored in memory, we’ll look for more information about the device object at
that address. We’ll use the command: dt nt!_DRIVER_OBJECT 86550220
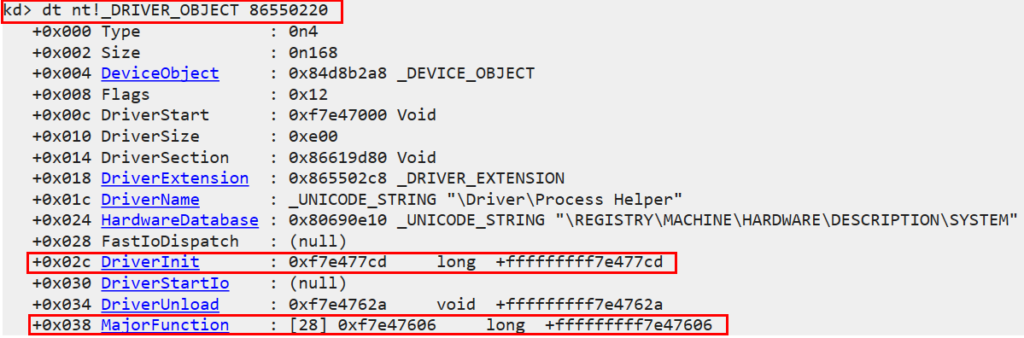
- We’ll continue to extract information about the functions the driver implements (MajorFunction) using the
command: dd 86550220+0x38 *dd
This command reads from memory and displays as 32-bit as a double value.
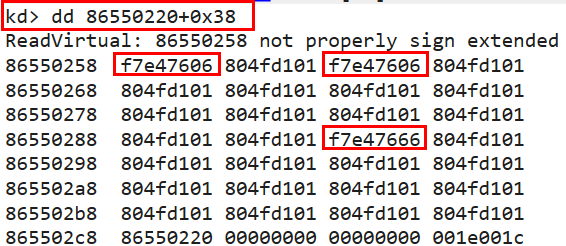
- Most addresses receive generic values (the lower addresses are not relevant) except for three addresses; these
are the functions the malware implements.
- We’ll continue to investigate each of these addresses using dump pointer symbols, with the command: dps 86550220+0x38, and we’ll find more information about these addresses in memory.
They are tagged as follows: Lab10-03 + 0x606 and Lab10-03 + 0x666.
- Now, we can decompile the malware, and from the start function, jump to the offsets we found.
Now we can really analyze what each function does.
If we continue the analysis, we’ll discover that essentially an unlinking of the currently running (malicious) process is performed. This is done by modifying the pointers in the doubly linked list of all processes loaded in memory, which actually point to each other. This modification involves changing the FLINK and BLINK fields of the EPROCESS Structure of the process immediately preceding the malicious one to point to the process following it. Similarly, the pointer of the process immediately following the malicious one is changed to point to the process before it (the one before the malicious process). This is actually the reason why we didn’t see the malicious process in Process Explorer during the initial analysis.
- Changing the pointers is actually accomplished through accesses to [eax], [eax+4], [ecx], and [ecx+4], similar to the operations one might perform if this code were written in any high-level language.
There, it would have looked something like this: node.next() and node.prev(), corresponding to the next and previous processes, respectively.
EPROCESS Structure - In Short😎
In general, each process in memory is represented by an EPROCESS Structure.
This structure is a memory block or, more precisely, a Kernel Object** that exists for every process, containing attributes that characterize the process.
Among these attributes are the pointers Flink, pointing to the next process, and Blink, pointing to the previous process. These structures in memory point to each other in a LinkedList-like manner.
Analysis - Second Rootkit2️⃣
- If we continue to investigate a bit in IDA Pro, we’ll discover that the malware creates a service with a driver that cannot be seen in the file system itself (but does have a trace in IDA Pro), answering to the name: WS Driver 486.
- We’ll make sure that the service the malware creates is still running (meaning the code in the kernel is still running); we’ll run in the Guest OS the following command:
sc query “WS Driver 486”
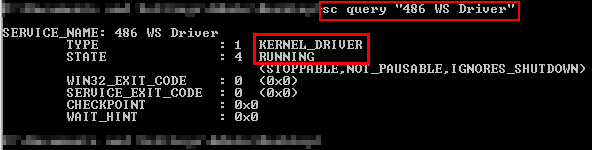
- The service is indeed still running, and the kernel driver is still in memory; we’ll continue to investigate this driver in
the kernel memory
We’ll review all the modules loaded in the kernel memory using the command lm**:
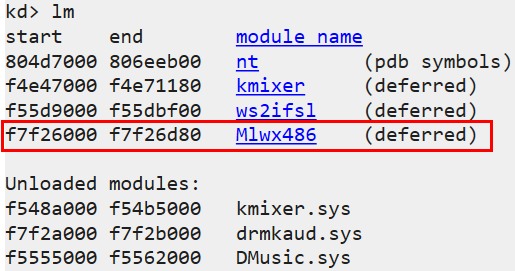
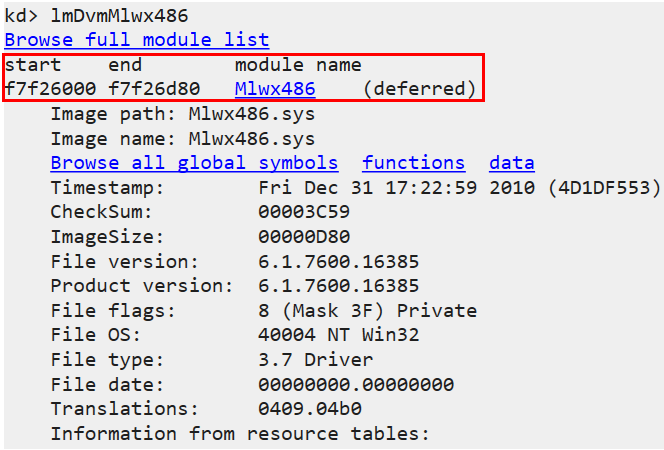
- We’ll click on the driver (which will cause the command: lmDvmMlwx486** to run).
This in turn will give us more information about the module in memory (the address at which it starts and ends in
memory and more…)
- Since it is a file that’s not appearing in our file system, it might involve SSDT Hooking.
SSDT Hooking is carried out at a specific address in the kernel memory so that a malicious function is called
instead of the intended function.
We’ll perform a dump of pointer symbols to the values in the SSDT (choosing to display 100 values), i.e., to the
functions that were loaded into the kernel, using the following command: dps KiServiceTable L100
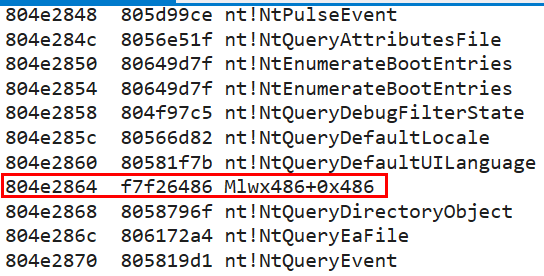
- Indeed, hooking was performed to one of the records in the SSDT Table in order to run a malicious function written
by the attacker.
- Now we’ll return to IDA Pro and see what happens at the corresponding address with the following offset: 0x486, and we’ll discover that the function on which the hooking is performed is: NtQueryDirectoryFile.
If we continue to investigate, we’ll discover that the hook will call the legitimate Windows API function if it involves any file whose name does not start with Mlwx; otherwise, a call will be made to the attacker’s function, which will cause the file to be deleted.
Analysis – Third Rootkit
After we've identified that a call to the API function ControlService is made in User Space, we’ll want to know what happens in Kernel Space as a result of this call.We’ll set a breakpoint in our VM at the address where this call is made, as follows: bp 0x00401080Let the Guest OS run (we’ll type ‘g’), and now we’ll initiate a break in the Host OS.In Host OS, we'll run the command:drvobj lab10-01!
to locate the driver we are investigating, this will help us find out whether there are device objects interfacing with it from User Space.
- We’ll ascertain that the driver is loaded to the address: 0x86629d00 and that it does not interface with any Device Object from User Space.
- Now that we have the address to which it is loaded, we’ll try to find more information about the driver using: dt
** nt!_DRIVER_OBJECT 86629d00**
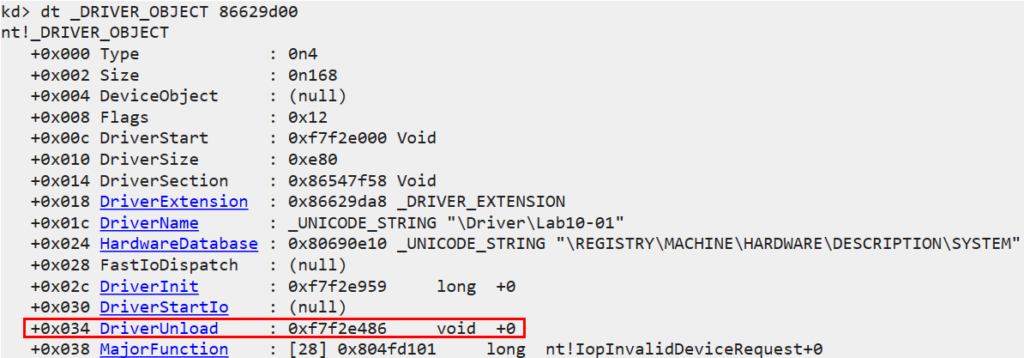
-
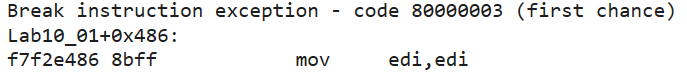
We’ll want to understand what happened before the driver is mapped out of memory and therefore we’ll set another breakpoint at the address 0xf7f2e486.
-
We’ll let the Guest OS run, wait for the breakpoint we set to stop the execution (in the Host OS), and see that the execution stopped at the following address in memory:
- We’ll run a series of commands using “Step Into,” and we’ll observe, as suspected, that multiple accesses to the registry
are indeed being made:
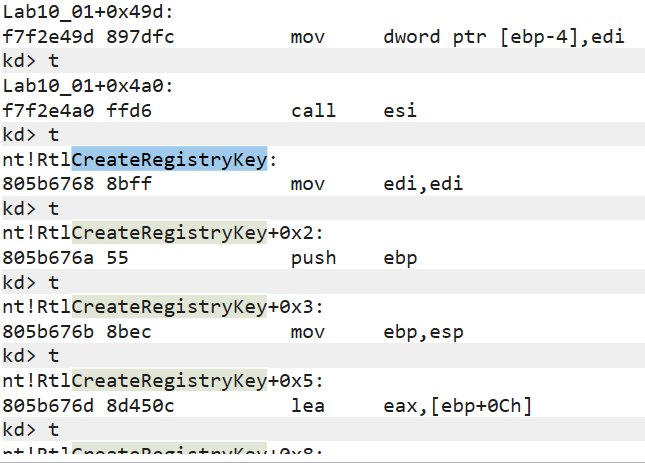
The next step in our investigation will be to return to IDA Pro and examine the addresses we’ve noted here, particularly where calls to RtlCreateRegistryKey are being made, to gain a broader understanding. By doing this, we’ll discover that the malware modifies values in the registry (changing them from ‘1’ to ‘0’) in order to disable the firewall.
So What Have We Seen❓
This article contains a wealth of practical information. Here’s what we discussed:
- What Rootkits are, their characteristics, and the memory space in which they predominantly operate.
- A brief elaboration on Kernel Space and User Space, including how Windows functions in the context of Drivers and Device Objects.
- Practical implementations of three different Rootkits and their appearance to the user at the endpoint.
- An explanation of how Kernel Debugging is performed and an overview of common tools for its execution, such as WinDbg and WinDbg Preview.
- An analysis of assembly code from the Rootkit component in each malware sample, including useful WinDbg commands and methods for analyzing kernel memory.
- An overall insight into the thought process we should adopt when investigating Rootkits and conducting Kernel Debugging.
- Additionally, a brief look at how Windows manages its processes, the EPROCESS Structure, and how malware exploits this structure (a Double Linked List where each process points to the one before and after it) to its advantage.
So, What’s Next❓
Another article has come to an end, in which we’ve polished our malware analysis skills and familiarized ourselves with the basics of Rootkit analysis.
The techniques we’ve explored here, alongside the fundamentals acquired in previous articles, will form our core skills when dealing with C++ compiled malware, Shellcode Analysis, and Unpacking malware.
Up next, since most malware today is packed, we should start learning how to unpack them.😈
References
- The following resources are taken from an amazing book called:
Practical Malware Analysis By Michael Sikorski and Andrew Honig
The three malware samples- The ‘kernel internals flow chart’ image
-
The EPROCESS Structure image
-
All other resources were generated through the analysis process.
GET IN TOUCH
Excited to learn more about Windows Malware Analysis? We just released our latest training on Windows Malware Analysis And Memory Forensics! You can find more information about it here. Please don’t hesitate to reach out to us through our Contact Us page if you have any questions.
Visit our training page if you’re interested in learning more about our other course offerings and want to develop your abilities further. Additionally, you may look through our Events page and sign up for our upcoming Public trainings.