Advanced Frida Usage Part 10 - Instruction Tracing using Frida Stalker
All parts in this series
- 1 Advanced Frida Usage Part 1 - iOS Encryption Libraries | 8kSec Blogs
- 2 Advanced Frida Usage Part 2 - Analyzing Signal and Telegram messages on iOS
- 3 Advanced Frida Usage Part 3 - Inspecting XPC Calls
- 4 Advanced Frida Usage Part 4 - Sniffing location data from locationd in iOS
- 5 Advanced Frida Usage Part 5 – Advanced root detection & bypass techniques
- 6 Advanced Frida Usage Part 6 - Utilizing writers
- 7 Advanced Frida Usage Part 7 - Frida Memory Operations
- 8 Advanced Frida Usage Part 8 - Frida Memory Operations Continued
- 9 Advanced Frida Usage Part 9 - Memory Scanning in Android
- 10 Advanced Frida Usage Part 10 - Instruction Tracing using Frida Stalker
Application Details
Name: Momo
Package Name: io.github.vvb2060.mahoshojo
SHA-256 Hash: 4605779cf733995d0a26cca54ab055d5cecbcf68fd710f5c7a4cb2e230826717
Introduction
Welcome to another blog in the series of Advance Frida Usage. This blog post takes a unique and intriguing approach by demonstrating how to use Frida’s Stalker APIs to trace instructions as they execute within an app in real time. Additionally, we’ll explore how to use various attributes of these instructions to extract valuable insights.
To demonstrate this, we are going to use a sample application which is developed by a user called vvb260 on Github. This application is a environment detector application which tells user whether their device environment is compromised or not by looking at various parameters such as root detection, SELinux permisions etc.
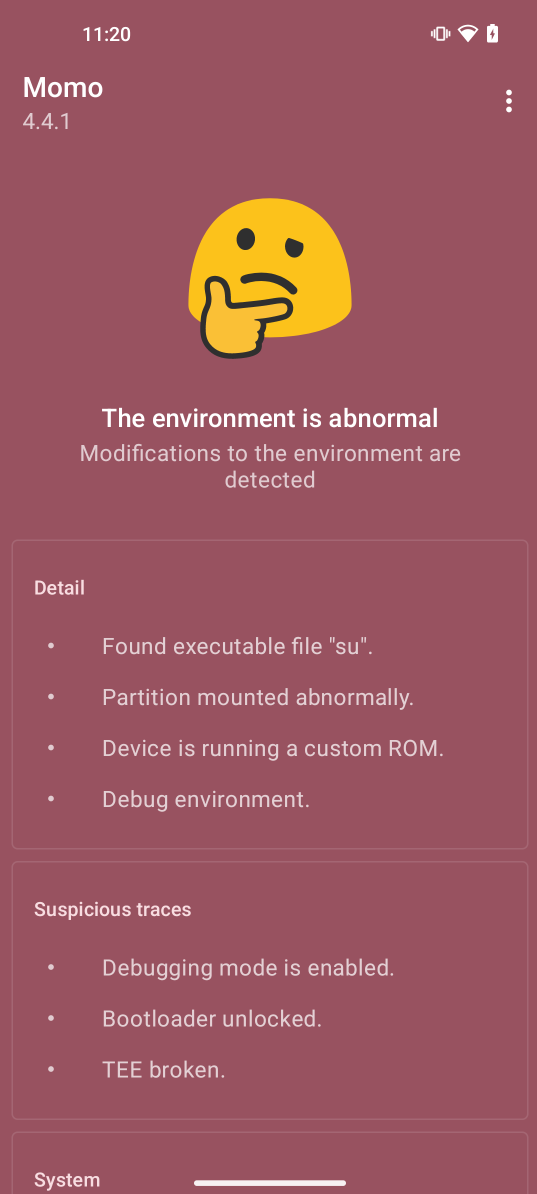
As it can be observed from the screenshot above, it says “The environment is abnormal” and then it shows what all things this app is detecting in the device.
Okay good enough! We are not here to understand what all these detections are and how we can bypass them but instead we are going to understand the usage of Frida Stalker APIs. So, Lets quickly jump into the analysis part of this application.
Analysis
To extract the APK file we are going to use apktool.
apktool d base.apk
Picked up _JAVA_OPTIONS: -Dawt.useSystemAAFontSettings=on -Dswing.aatext=true
I: Using Apktool 2.9.1 on base.apk
I: Loading resource table...
I: Sparsely packed resources detected.
I: Decoding file-resources...
I: Loading resource table from file: /home/kali/.local/share/apktool/framework/1.apk
I: Decoding values */* XMLs...
I: Decoding AndroidManifest.xml with resources...
I: Regular manifest package...
I: Baksmaling classes.dex...
I: Copying assets and libs...
I: Copying unknown files...
I: Copying original files...
I: Copying META-INF/services directory
Once the application is extracted we can directly jump into the lib/arm64-v8a directory inside the newly created base directory where we can find the libmahoshojo.so library. This library is responsible in this application to perform all these detections and decides whether the Device Environment is safe or not. For analysis, we are going to use ghidra disassembler. So, lets open this library in ghidra and start the analysis:
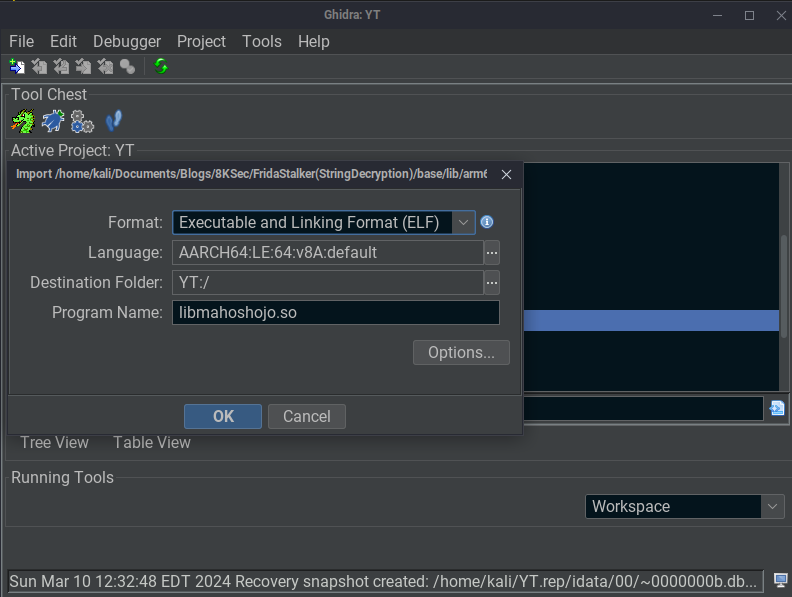
After importing the library in ghidra it will ask whether to Analyze the binary or not.
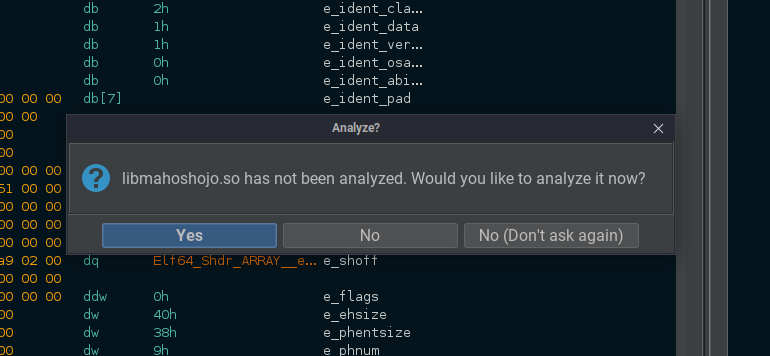
Just hit “Yes” and let ghidra analyze the library. After a short period of time the analysis will get completed and you will be able to see the disassembly of this library along with imported and exported symbols.
Okay so now lets try to perform some static analysis in order to find interesting functions or routines. As part of its security checks, the app aims to detect device compromise by examining factors like root status and SELinux enforcement. Drawing from our previous experiences, we understand that applications often need to access specific paths in the device filesystem to detect certain conditions. For instance, to identify whether the device is rooted or not, an app typically checks the /system directory for the presence of the su binary. Additionally, these apps may make function calls, such as openat(), using SVC (Supervisor Call) instructions to prevent attacker or reverse engineers from understanding the detection logic simply by looking at the disassembled code.
Based on this assumption that this application is also trying to make SVC instruction calls lets try to search for these instructions in ghidra by clicking on “Search” followed by “Program Text”.
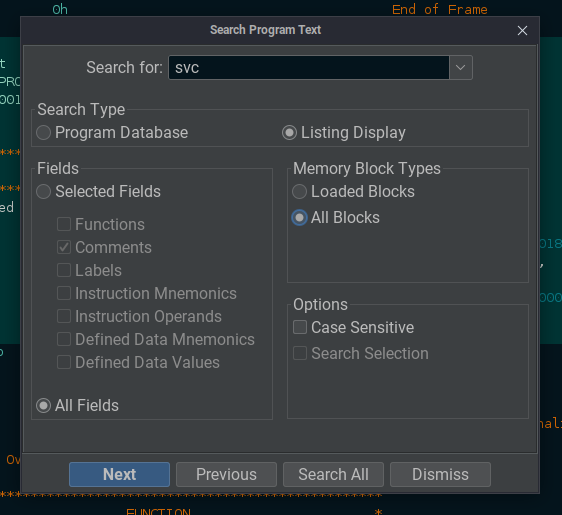
Make sure to select “All Fields” and “All Blocks” so that ghidra will search in all the segments for SVC instruction. Once ghidra search completes we can observe lot of SVC calls being made as shown below:
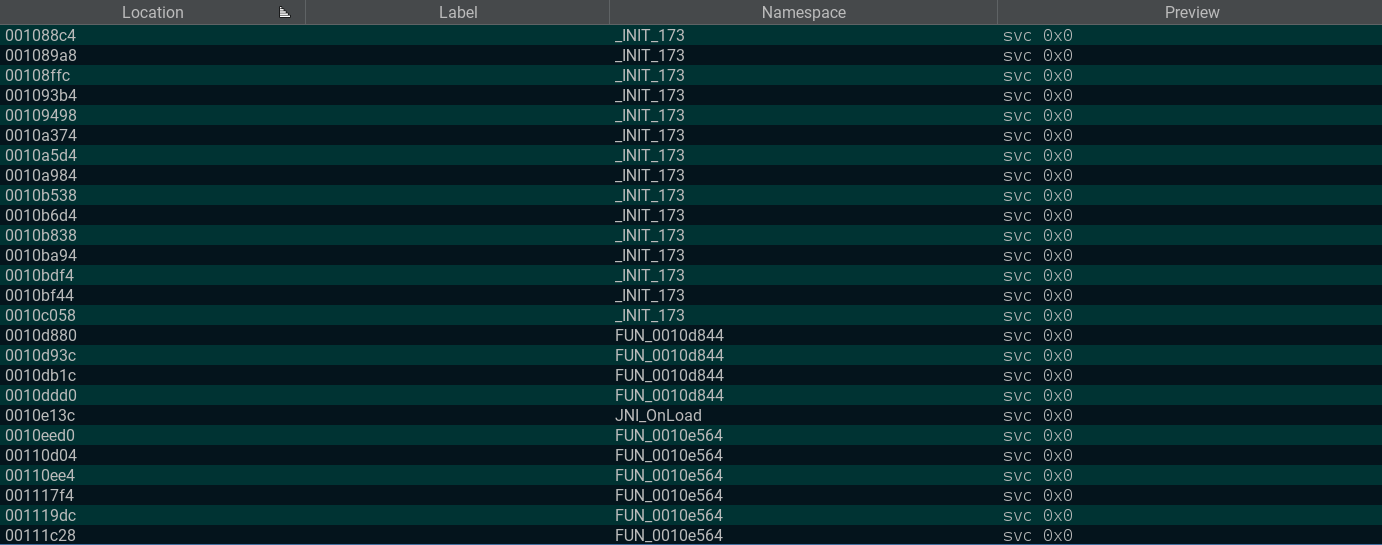
There are various places from where this SVC instruction is being called. So, for now lets pick the first result which is coming from INIT_173() function at offset 0x1088c4. Note that this offset we need to adjust because in ghidra it adds its own Image Base Address which we can see by going into the Memory Map:
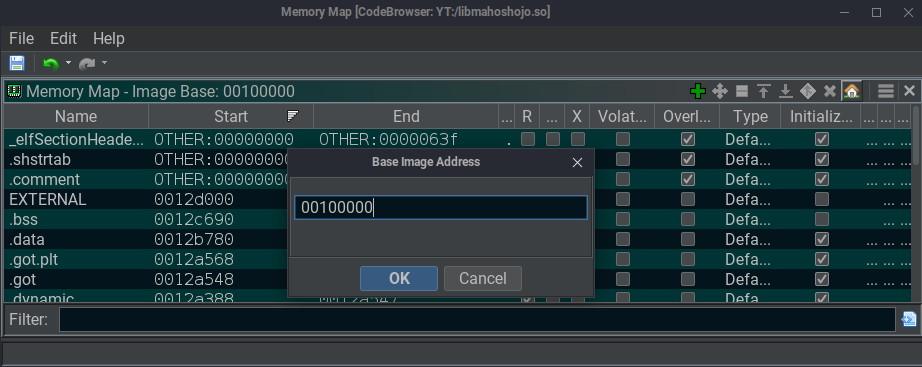
Here, you can observe that Image Address is set to 100000 currently. We need to modify it to 000000. Simply change this and hit OK. Now, lets search again for SVC instructions and observe the offsets:

Now from the first result the offset where this SVC instruction is getting called is 0x88c4. Now we can directly use these offsets in our frida scripts.
Okay so lets go to this INIT_173() function in ghidra which is present under exports.
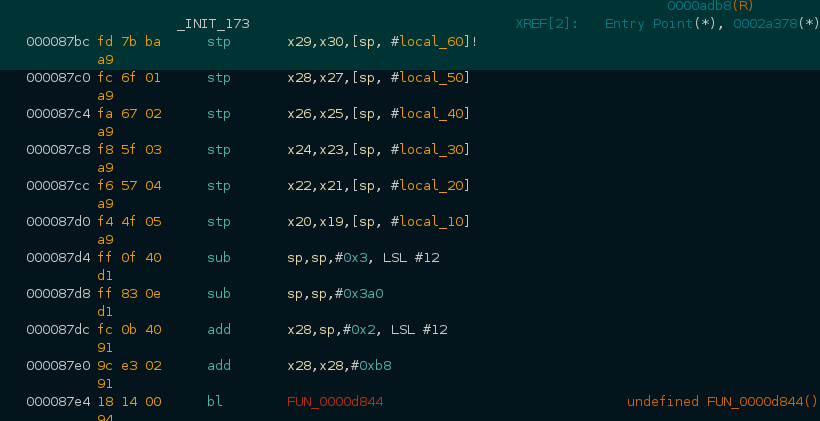
Note here that these INIT functions these are not real functions but the routines which ghidra has identified as functions because they are involved during the initialization phase of the application.
As a next step, lets try to attach the hook at the address from where INIT_173 function is defined i.e 0x87bc. So, lets create a new frida script:
Interceptor.attach(Module.findExportByName(null, "android_dlopen_ext"), {
    onEnter: function (args) {
        var libraryPath = Memory.readCString(args[0]);
        if (libraryPath.includes(libraryName)) {
            console.log("[+] Loading library " + libraryPath + "...");
            isLibLoaded = true;
        }
    },
    onLeave: function (args) {
        if (isLibLoaded) {
            isLibLoaded = false;
            hookINIT_173();
        }
    }
});
Here, firstly we are going to intercept android_dlopen_ext method because this method is responsible to load native libraries required by the application at runtime in memory. So we are simply going to intercept this function and wait until our target library which is libmahoshojo.so gets loaded. Once its loaded we are going to call a function which we are going to define called hookINIT_173().
function hookINIT_173(){
    const targetModule = Process.getModuleByName("libmahoshojo.so");
    Interceptor.attach(targetModule.add(0x87bc),{
        onEnter: function(args){
            console.log("[+] _INIT_173() entering...");
            startStalker(this.threadId, targetModule);
        },
        onLeave: function(retval){
            console.log("[+] _INIT_173() leaving...");
            stopStalker(this.threadId);
        }
    });
}
In the above code, firstly we are going to store the handle of our library in a targetModule variable. We’ll utilize the Interceptor.attach() API from Frida to attach a hook at offset 0x87bc. Within the onEnter callback, we’ll invoke the startStalker() method, and in the onLeave callback, we’ll call the stopStalker() method. Let’s proceed to define these functions.
function startStalker(threadId, targetModule){
    var modules = Process.enumerateModulesSync();
    modules.forEach(mod => {
        if ((mod.name.indexOf("libmahoshojo")) < 0) {
            console.log(`Excluding '${mod.name}'.`);
            // We're only interested in stalking our code
            Stalker.exclude({
                "base": mod.base,
                "size": mod.size,
            });
        }
    });
    Stalker.follow(threadId, {
        transform: function (iterator) {
            var instruction;
            while ((instruction = iterator.next()) !== null) {
                // condition to putCallout
                if (instruction.address >= targetModule.base) {
                    iterator.putCallout(function(context) {
                        var offset = ptr(context.pc).sub(targetModule.base);
                        var instStr = Instruction.parse(context.pc).toString();
                        console.log(`${offset} ${instStr}`);
                    });
                }
                iterator.keep();
            }
        }
    });
}

function stopStalker(threadId){
    Stalker.unfollow(threadId);
    Stalker.flush();
}
Okay, so there are two parts in startStalker() method. In the first part we are going to exclude some of the modules which we are don’t want to trace. This is useful to improve the efficiency of the stalker and to avoid unnecessary crashes when stalker tried to stalk module which is not part of the application.
So in the first part basically we are using Stalker.exclude() API to exclude all the modules loaded by the application except libmahoshojo which we have filtered using if condition.
Then comes the interesting part. Using Stalker API itself. Before proceeding, it’s crucial to understand that attempting to trace all threads and instructions within an application can be resource-intensive. Doing so may render the app unresponsive or, in extreme cases, cause it to crash. So to limit this we have identified the function we are interested in using static analysis and now we are only going to trace this function. For this there is Stalker.follow() API which takes threadId as its first argument followed by a body. Inside this body we have a field called transform. The transform function is called for each instruction encountered during the execution of the traced thread. It receives an iterator object as its parameter. inside the tranform function, the code iterates through the instructions executed by the thread. So, the primary purpose of the transform function is to inspect and manipulate the instructions being executed.
So, inside this transform function firstly we have put a check using if condition to make sure that the instructions which we are going to transform are coming from the module in which we are interested in. For that we are checking the instruction address whether its within the address range of the targetModule or not. Once this condition is met, then we are calling iterator.putCallout(). This callout method basically logs the information about the executed instruction along with the instruction offset via console.log() function. To calculate the instruction offset, we can use context variable which is available inside putCallout() method. In order to find the offset we are going to subtract the targetModule base address with the address present in program counter register.
var offset = context.pc.sub(targetModule.base);Similarly, to print the disassembly of the current instruction we have Instruction.parse() API which takes the instruction address and convert it into its disassembly.
var instStr = Instruction.parse(context.pc).toString();Then finally, when the function/method which we wanted to trace i.e INIT_173() in this case inside onLeave we have to make sure to unfollow the Stalker API. So, for that we have defined this stopStalker() method where to unfollow the trace we are calling Stalker.unfollow(threadId). This method takes threadId as the input which should be same as the one used when we started the Stalker using Stalker.follow(threadId).
Okay, so once this is done. We are all set to test our script and see whether we are able to trace all the instructions within INIT_173() routine.
Spawned io.github.vvb2060.mahoshojo. Resuming main thread!
[KB2001::io.github.vvb2060.mahoshojo ]-> [+] Loading library /data/app/~~PoC-T59nqfePJn6mv6LNeA==/io.github.vvb2060.mahoshojo-2k7tn-uXoBgasDkE3jm30g==/base.apk!/lib/arm64-v8a/libmahoshojo.so...
[+] INIT_173() entering...
0xd854 stp x22, x21, [sp, #0x40]
0xd858 stp x20, x19, [sp, #0x50]
0xd85c sub sp, sp, #1, lsl #12
0xd860 sub sp, sp, #0xf0
0xd864 add x8, sp, #0xb0
0xd868 add x9, sp, #0x90
0xd86c str x8, [sp, #0x10b0]
0xd870 ldr x8, [sp, #0x10b0]
0xd874 str x9, [sp, #0x10b8]
0xd878 ldr x8, [sp, #0x10b8]
0xd87c mov x8, #0xac
0xd880 svc #0
0xd884 str x0, [sp, #0x10e0]
0xd888 ldr x8, [sp, #0x10e0]
.....
0xdaac movk w9, #0x875a, lsl #16
0xdab0 cmp w8, w9
0xdab4 mov w9, w8
0xdab8 b.ne #0x798e25ba54
0xdabc b #0x798e25bff4
0xdff4 ldr x8, [sp, #0x10b8]
0xdff8 ldr x8, [sp, #0x10b0]
0xdffc add sp, sp, #1, lsl #12
0xe000 add sp, sp, #0xf0
0xe004 ldp x20, x19, [sp, #0x50]
0xe008 ldp x22, x21, [sp, #0x40]
0xe00c ldp x24, x23, [sp, #0x30]
0xe010 ldp x26, x25, [sp, #0x20]
0xe014 ldp x28, x27, [sp, #0x10]
0xe018 ldp x29, x30, [sp], #0x60
0xe01c ret
[+] INIT_173() leaving...
The output is truncated here because its a very long trace. But the point is now that we are able to log each and every single instruction which is being executed by INIT_173() routine.
These instruction traces are useful in many ways such as when dealing with obfuscated code where you don’t know which instruction is going to be executed next simply by looking at the disassembly.
Okay, Once we have this trace and our script we can basically do whatever we want. Now we have the control at each and every instruction being executed by the application. So, to demonstrate the power of Stalker here we are going to intercept the memory operations (read/write).
The instruction object which we have retrieved using Instruction.parse() contains lot of useful attributes including the type of instruction, number of registers access, operands and their values. To better understand it lets see how this instruction object looks like:
{"address":"0x78a4789148","next":"0x78a478914c","size":4,"mnemonic":"str","opStr":"q0, [sp]","operands":[{"type":"reg","value":"q0","access":"r"},{"type":"mem","value":{"base":"sp","disp":0},"access":"rw"}],"regsAccessed":{"read":["q0","sp"],"written":[]},"regsRead":[],"regsWritten":[],"groups":[]}From here you can observe that we have mostly all the information about the instruction. Now lets leverage this instruction object to only log the instructions which are related to memory by using the type attribute which is present inside operands[].
iterator.putCallout(function(context) {
    var offset = ptr(context.pc).sub(targetModule.base);
    var instStr = Instruction.parse(context.pc).toString();
    var instruction = Instruction.parse(context.pc);
    for(let op of instruction.operands) {
        if(op.type == "mem" && op.value.base) {
            if(op.access == "w" || op.access == "rw") {
                console.log(`write -> [${JSON.stringify(op.value)}, ${instruction.mnemonic}, ${instruction.opStr}]`);
            } else {
                console.log(`read -> [${JSON.stringify(op.value)}, ${instruction.mnemonic}, ${instruction.opStr}]`);
            }
        }
    }
});
So, inside iterator.putCallout() we have our instruction object right. Let’s try to iterate over all the operands in this instruction object (There could be multiple operands in an arm64 instruction). To access the operands from the instruction we can simply use . operator just like we do with any other object.
for(let op of instruction.operands){
}
Using this for loop we are going to iterate over all the operands of the instruction. Then to check whether the instruction type is memory or not we can access type attribute of operand.
if(op.type=="mem"){
}
Now, inside this if condition we have to check the type of memory operation whether its a read operation or write operation. For that we can make use of access attribute of operand.
if(op.access == "w" || op.access == "rw"){
    //write operation
} else {
    //read operation
}
For write operation the access type would be “w” or “rw”. Then finally inside these if conditions we can print out the instructions along with other useful information.
Lets give the script a try and see what do we get in the log now:
[+] INIT_173() entering...
write -> [{"base":"sp","disp":64}, stp, x22, x21, [sp, #0x40]]
write -> [{"base":"sp","disp":80}, stp, x20, x19, [sp, #0x50]]
write -> [{"base":"sp","disp":4272}, str, x8, [sp, #0x10b0]]
read -> [{"base":"sp","disp":4272}, ldr, x8, [sp, #0x10b0]]
write -> [{"base":"sp","disp":4280}, str, x9, [sp, #0x10b8]]
read -> [{"base":"sp","disp":4280}, ldr, x8, [sp, #0x10b8]]
write -> [{"base":"sp","disp":4320}, str, x0, [sp, #0x10e0]]
read -> [{"base":"sp","disp":4320}, ldr, x8, [sp, #0x10e0]]
write -> [{"base":"x24","disp":40}, strb, w8, [x24, #0x28]]
read -> [{"base":"x24","disp":40}, ldrb, w8, [x24, #0x28]]
read -> [{"base":"sp","disp":4320}, ldr, x3, [sp, #0x10e0]]
write -> [{"base":"sp","disp":240}, str, x30, [sp, #0xf0]]
write -> [{"base":"sp","disp":224}, stp, x10, x9, [sp, #0xe0]]
write -> [{"base":"sp","disp":208}, stp, x12, x11, [sp, #0xd0]]
write -> [{"base":"sp","disp":0}, stp, q0, q1, [sp]]
.....
read -> [{"base":"sp","disp":8}, ldr, x0, [sp, #8]]
read -> [{"base":"x16","disp":1632}, ldr, x17, [x16, #0x660]]
write -> [{"base":"x8","disp":2784}, str, w0, [x8, #0xae0]]
read -> [{"base":"sp","disp":4304}, ldr, x8, [sp, #0x10d0]]
read -> [{"base":"sp","disp":4304}, ldr, x0, [sp, #0x10d0]]
read -> [{"base":"x16","disp":1512}, ldr, x17, [x16, #0x5e8]]
read -> [{"base":"x8","disp":1768}, ldr, w8, [x8, #0x6e8]]
read -> [{"base":"sp","disp":4280}, ldr, x8, [sp, #0x10b8]]
read -> [{"base":"sp","disp":4272}, ldr, x8, [sp, #0x10b0]]
read -> [{"base":"sp","disp":80}, ldp, x20, x19, [sp, #0x50]]
read -> [{"base":"sp","disp":64}, ldp, x22, x21, [sp, #0x40]]
read -> [{"base":"sp","disp":48}, ldp, x24, x23, [sp, #0x30]]
read -> [{"base":"sp","disp":32}, ldp, x26, x25, [sp, #0x20]]
read -> [{"base":"sp","disp":16}, ldp, x28, x27, [sp, #0x10]]
write -> [{"base":"sp","disp":0}, ldp, x29, x30, [sp], #0x60]
Okay cool. So now we can trace all the memory related instructions. This is useful in case you are interested to trace only specific set of instructions.
As a next step, you can try to dump the data from the memory pointed out by these instructions by making use of operands. But for this blog that’s all we have.
We’ll see you with our next post in this series.
Get in Touch
Want to learn these techniques hands-on, or need help assessing your own mobile or AI stack? We run live and on-demand trainings, offer mobile-security certifications, and take on penetration-testing engagements. Pick the door that fits.
We respond within one business day. Visit our events page to see where we'll be next.


