
Android
Android SELinux Internals Part II - SELinux Domains, Denials, and Bypass with Root Tools
8kSec Research Team ·
Learn mobile & AI security at your own pace with self-paced video courses, hands-on labs, and certifications.
 OnSite
 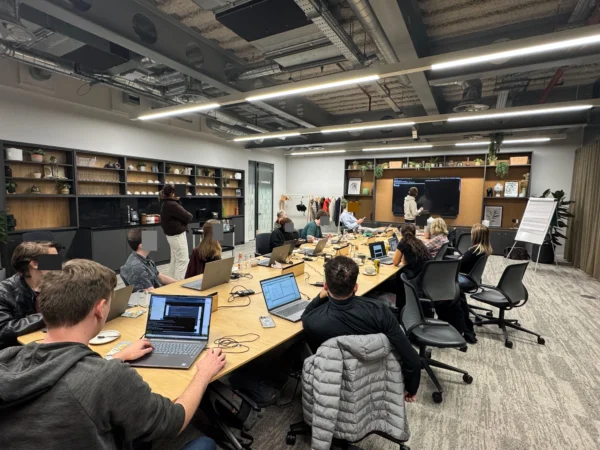 OnSite
  OnSite
 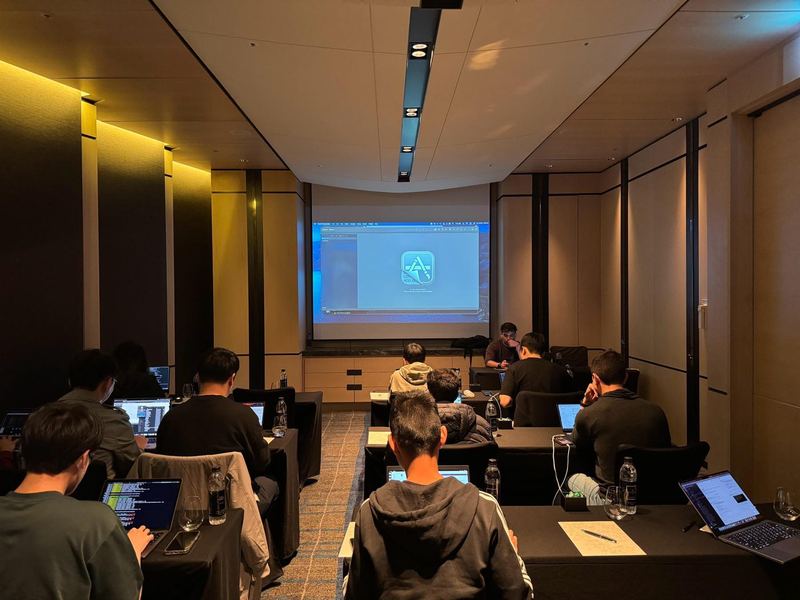 OnSite
 Step into the arena. Tackle real-world security challenges across mobile platforms, ARM architecture, and AI systems with hands-on labs.
 New
New Online · Self-Paced
Learn More about Practical AI Security - Attacks, Defenses, And Applications Bestseller
 Online · Self-Paced
Learn More about Offensive Mobile Reversing And Exploitation
Online · Self-Paced
Learn More about Practical Mobile Application Exploitation
Online · Self-Paced
Learn More about Offensive iOS Internals
Online · Self-Paced
Learn More about Offensive Android InternalsEmbark on a Practical Journey: Our certification program in mobile security isn't just about theory – it's completely hands-on. Through our exams, students will actively identify vulnerabilities and learn to exploit them, gaining real-world expertise through practical challenges and lab-based exploration.
All Certifications 
As a recent researcher looking for ways to expand my knowledge, I was always on the lookout to find courses that may aid me in the better understanding of mobile security. Thus, I was recommended to take the Offensive iOS Internals course offered by 8ksec.io. The course is well-structured and comprehensive, covering topics and modules that are essential for diving into the iOS security domain.Read More..
Mohammed Alshamsi
Security Engineer
The Practical Mobile Application Exploitation course is packed with valuable content that offers in-depth insights into mobile security architectures for both Android and iOS platforms. The material is comprehensive and well-structured, making it easy to grasp key concepts. One of the highlights of the course is its reverse engineering section, which is excellent.Read More..
Darius Swain
Senior Pentester
I'm currently enrolled in the Practical Mobile Application Exploitation (PMAE) program by 8ksec. The course is delivered through video-based lessons that not only cover theory but also walk through practical examples in detail, which greatly enhances the learning process. I find this learning approach more engaging and effective.Read More..
Sergei Shpakov
Senior Security Analyst
Our trainers boast more than ten years of experience delivering diverse training sessions at conferences such as Blackhat, HITB, Power of Community, Zer0con, OWASP Appsec, and more.

Real, unedited feedback from security professionals on LinkedIn.
Can't make it to a public event? We deliver on-site training directly at your location. Our instructors travel worldwide — tell us where you are.
Your country not listed? We still travel there.
Get in Touch
As a leading cyber security research company, we offer consulting and training services to help organizations strengthen their digital defenses. From Defense entities in US, EU, MEA to commercial agencies, you can be confident that any need for expertise is met with standardization-driven approaches tailored specifically for your organization's needs.
At the forefront of cybersecurity training and services, we collaborate with industry leaders to deliver cutting-edge solutions. Our expertise spans various security frameworks and methodologies.
Become a Partner


Get cutting-edge mobile & AI security research, vulnerability deep-dives, and hands-on exploitation techniques delivered to your inbox. Plus early access to upcoming trainings and certifications.
Trusted by professionals at


Please share with us the project requirements and the goals you want to achieve, and one of our sales representatives will contact you within one business day.
51 Pleasant St # 843, Malden, MA, Middlesex, US, 02148